Tuesday, June 29, 2010

Unit 7: Location Decisions- on your own


This week I was presented with the opportunity to create a location decision based on parameters I chose. I chose to use a similar output to last weeks guided exercise with some variations on the data used. The variables I chose were age 18-21, rent $500-549, distance form psych clinic and distance from community college. Overall I feel that I benefited more from doing a similar output to the previous week in that I was able to perfect the same skills instead of trying to learn and recall old tasks which I did not have the time to do.

Tuesday, June 22, 2010

Week 6: Urban Planning: Alachua County Location Decisions


This week I was asked to created a series of maps based on parameters requested from a couple looking to move close to their grandchildren at UF. Overall, the exercise provided very clear helpful instructions that allowed me to complete the somewhat difficult tasks. Few problems occured from a few areas where detail was left out but the discussion board provided the neccessary feedback from such outcomes.

Sunday, June 13, 2010

Oil Spill Activity

A disaster of any magnitude can be a devastating event; however, GIS can help mitigate such events. In any, disaster the first task at hand is to understand the event that has occurred and in the case of a deep water oil spill the first step is no different. Using GIS can help show the location of an event and help orientate agencies to the disasters location. Communication is an immense aspect of disaster coordination and this is where GIS visualizations are invaluable. When speaking in terms of the deep water oil spill in the Gulf of Mexico, GIS has produced many maps and animations for many different audiences. For many, a map of the exact location of the oil rig where the event occurred was the starting visual aid. Once the location of this event was established GIS can then help further explain the dynamics of the situation.

GIS work is indispensable in today's world, especially in disaster relief coordination. Its ability to consolidate huge amounts of data into easy to understand visual aids allows for many agencies to work together to minimize the effects of these events. With the current oil spill, there are many agencies both state, federal and public that are working congruently to both stop and alleviate the effects of one of the worst disasters in history. Information needs to be portrayed regarding jurisdiction to the many agencies that will help with oil mitigation both on the open ocean and soon, all along the gulf coast. To do this, federal agencies such as FEMA, individual state agencies and public companies (BP) need personalized visual data to help them accomplish their goals. GIS accomplishes these goals by allowing for fast transfers of information in to customized maps and projections.

Perhaps greater prevention will come from this tragic event. Many agencies in current times are utilizing GIS to help plan and prevent for disasters. If a plan of action had been put in place for the oil rig to help better contain such an event there might have been a possibility that the wide spread environmental impact could have been reduced. Implementing boom locations, promoting interagency course of action plans to allow for faster response times and having access to other environmental data may have saved billions of dollars and hopefully one day such plans will be mandated accordingly.

Tuesday, June 8, 2010

Week 4- Natural Hazards: Oil Spill


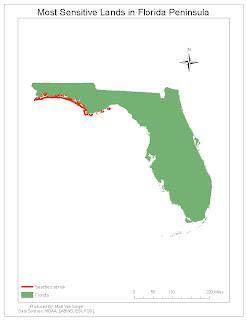
The above maps are presented to help show the many aspects at which GIS can help in a disaster. The ability to map hazards, environmentally important lands, areas of highest concern and also to plan a course of action is invaluable to many relief efforts. These maps show the socioeconomic impacts of an oil spill by mapping areas of importance- such as marinas, the ecological impact of an oil spill by showing how many and what type of creatures will be affected and also what areas of management each location falls under to better plan a relief effort.

Wednesday, June 2, 2010

Unit 3: Hurricanes


I had seemingly a lot of problems with this assignment. After the initial map delieverable I was unable to both convert the elevation map to meters as well as simply show the land under 2.44m that would be flooded by the 8 foot storm surge. Datum errors plagued me even after trying everything offered on the discussion board; starting up with only elev and trying to convert, checking (and double checking) data properties and consequently this did not allow me to go any further in the assignment. I completed the worksheet to the best of my ability and researched to find out what happened in each situation and hopefully will have better luck next time.

In October of 2005 hurricane Wilma decimated the Florida Keys as a catergory 3 Hurricane. With most of the land in Key West being no more than a few feet above sea level and the storm surge from Wilma over a feet the city prepared for disaster. When the storm surge hit there was massive flooding most of the island with some areas being under almost 4 feet of salt water for days at a time. Many developed areas of land were flooded and destroyed by long standing sea water. The flooding costed billions of dollars in damages to homes and tourist locations and also made it very difficult for resuers to come to their aid. The airport was flooded on the side of the island that was just above sea level in addition to the roads being submerge and canals overflowing. Although a majority of the flooding was done to developed areas the undeveloped areas (barren) and forested areas were also affected in a big way. Ecologically the city was affected as well with swamps, marshes and barrier reefs damaged severely. Long term the island will provide sustainability as a tourst location but the environment may have taken the biggest blow.